
Slider shows the probability of an event in percentage - corresponding to the bookmaker's odds * excluding the margin.
1. Enter or Select Team Names
- Type the team names manually or use the filling checkbox.
- If using filling, type the first three letters and select from the list.
- It's best to use official English team names (like on OddsPortal, FlashScore, Transfermarkt etc.).
2. Enter the Opening Odds for the Home Team
- Input the opening odds **for the home team** when the bookmaker first releases them.
- Set the + and - range to define a search window.
- Example: If the odds are 2.00, setting +0.1 and -0.1 will search within 1.90 - 2.10.
- Always set a range to get more match results.
3. Enter the Closing Odds for the Home Team
- Do the same as in Step 2, but for the odds just before the match starts.
4. Set the Over 2.5 Opening Odds
- Enter the opening odds for the Over 2.5 goals market.
- Use + and - range as in Step 2.
5. Set the Over 2.5 Closing Odds
- Same as Step 4, but for the closing odds before the match.
6. Select a Bookmaker
- Choose the bookmaker whose odds you want to analyze.
7. Select the Start Date for Statistics
- Choose the date from which you want to start collecting match stats.
8. Filter by Previous Match Score
- Enter a past match score to see how teams performed in the next matches.
All filters can be applied together or separately. The only required input is the team name.
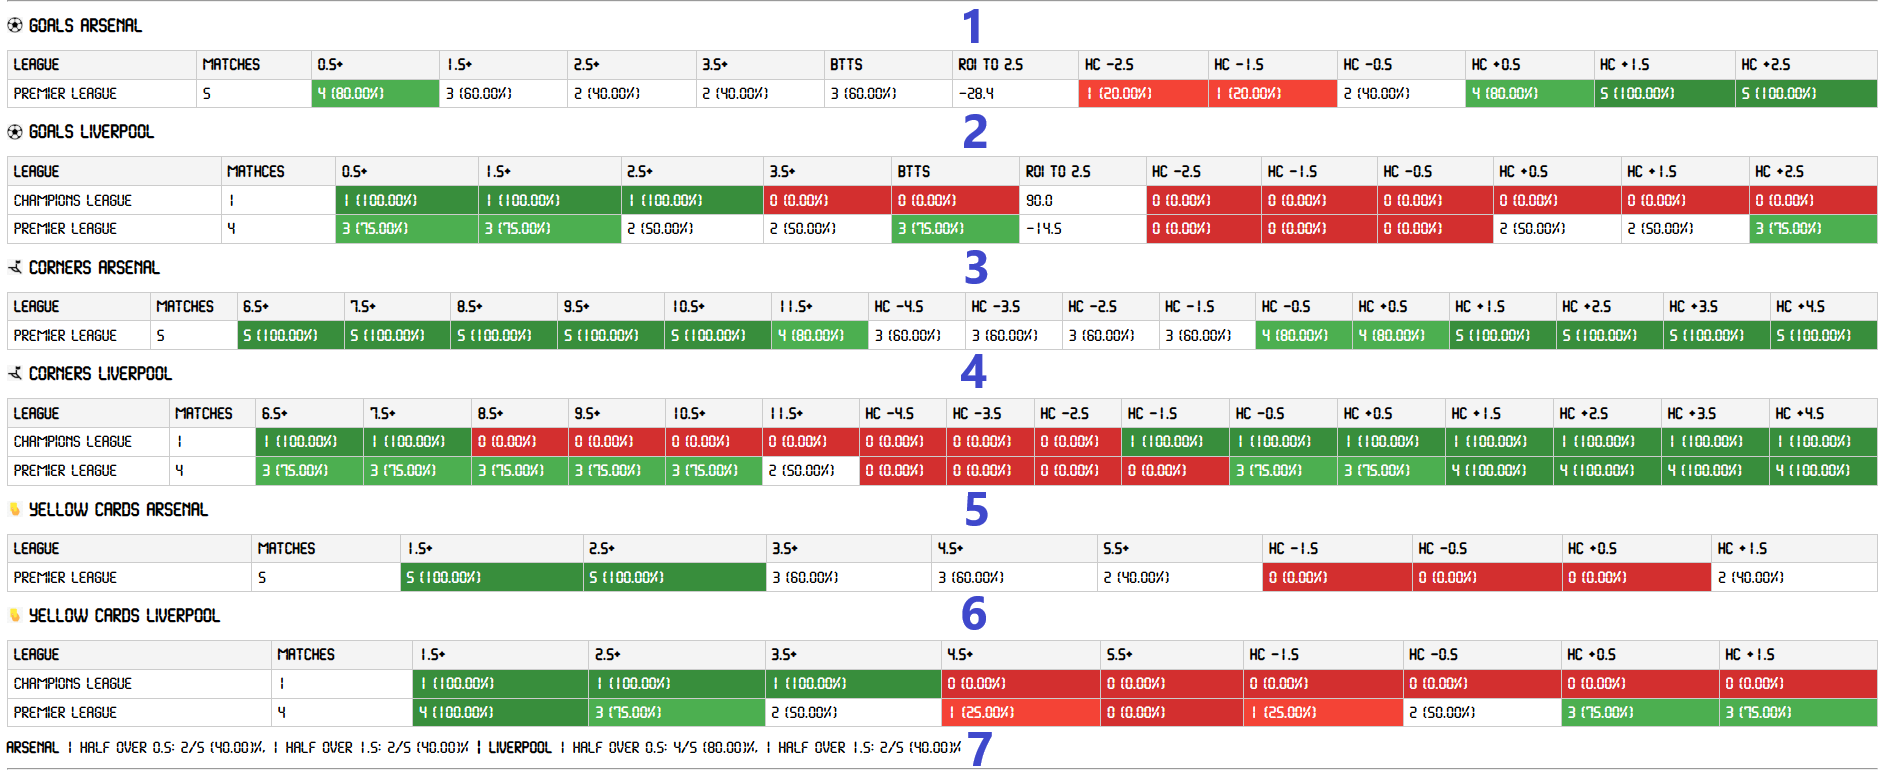
1. Team Performance Overview
Here are the past match results of the first team, filtered based on the selected criteria.
- 0.5+ - 3.5+: Number of matches with the corresponding "Over" total.
- BTTS: Matches where both teams scored.
- ROI TO 2.5: Return on investment (ROI) based on the closing odds.
- HC-2.5 / HC+2.5: Number of matches with the corresponding handicap.
2. Second Team Performance
The same statistics as above, but for the second team.
3. Corner Totals & Handicaps
- Number of matches with "Over" totals and handicaps for corners.
- First team data.
4. Corner Stats for the Second Team
The same corner statistics, but for the second team.
5. Yellow Card Totals & Handicaps
- Number of matches with "Over" totals and handicaps for yellow cards.
- First team data.
6. Yellow Card Stats for the Second Team
The same yellow card statistics, but for the second team.
7. First-Half Totals
Total goals for both teams in the first half.
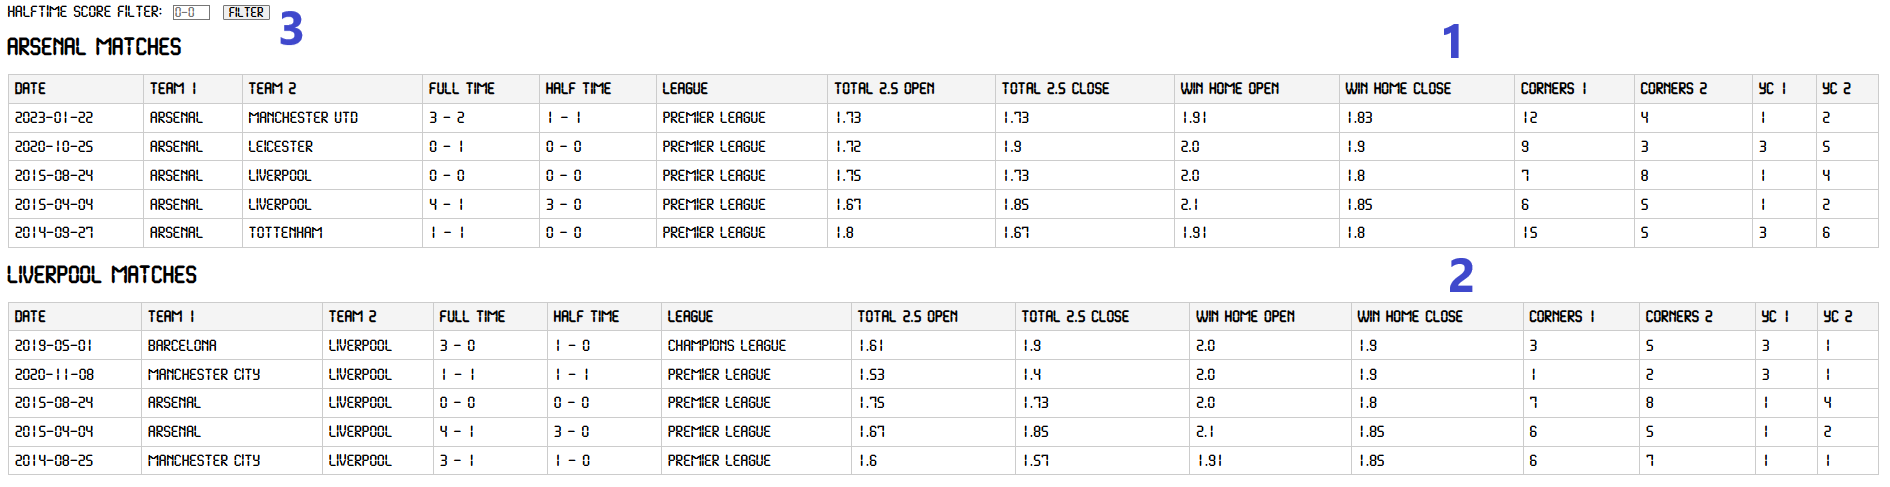
1. Table of Matches for the First Team
Displays matches found based on the selected filters for the first team.
2. Table of Matches for the Second Team
Shows filtered matches for the second team.
3. First-Half Results Filter
Apply a filter to view only matches based on first-half results.
 SOCCER
 HOCKEY
 HANDBALL
 BASKETBALL